Given a forecast with raw realizations, generate a plot displaying all of them.
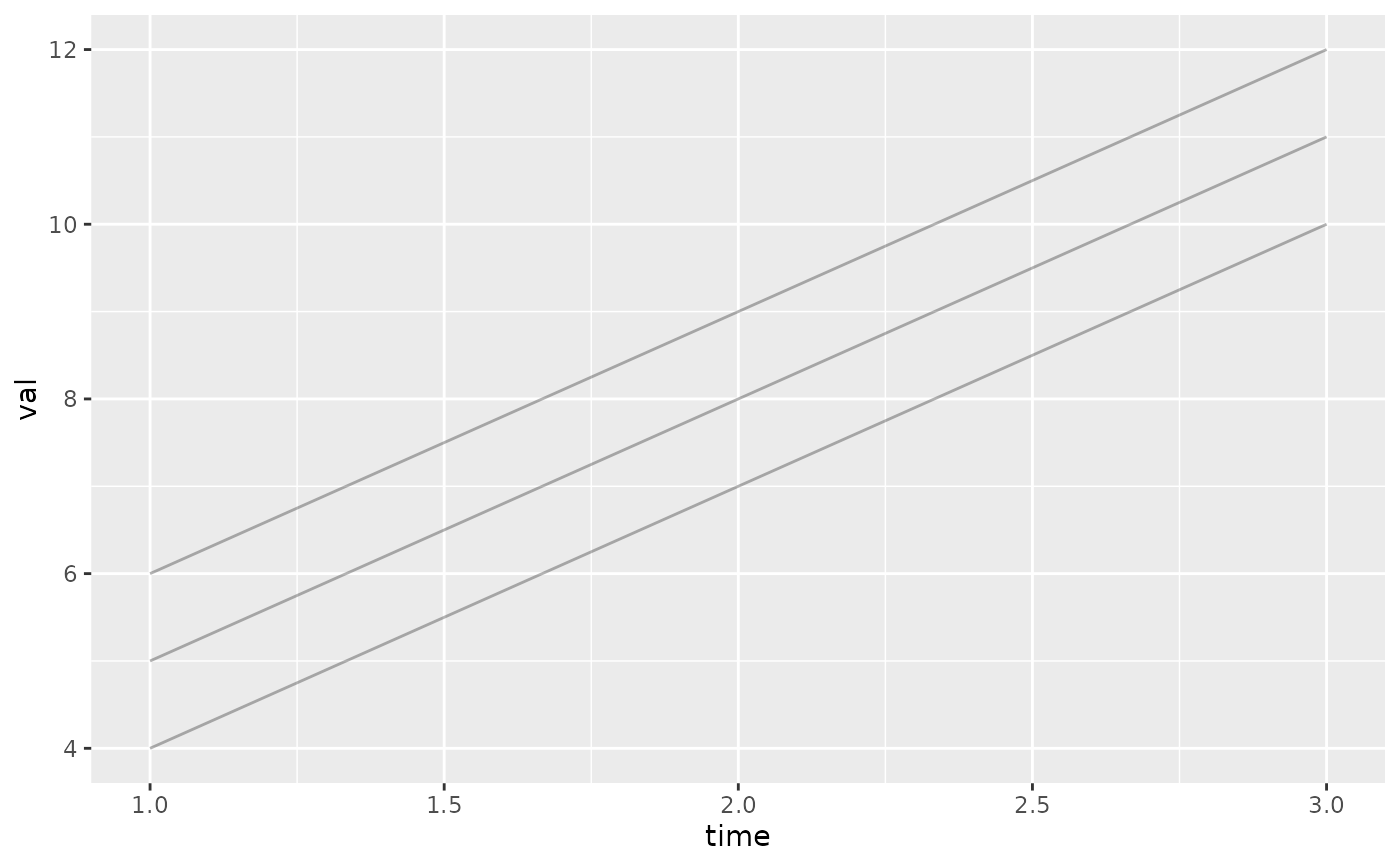
If the forecast provides simulation numbers (sim column), the ensemble of curves will be plotted.
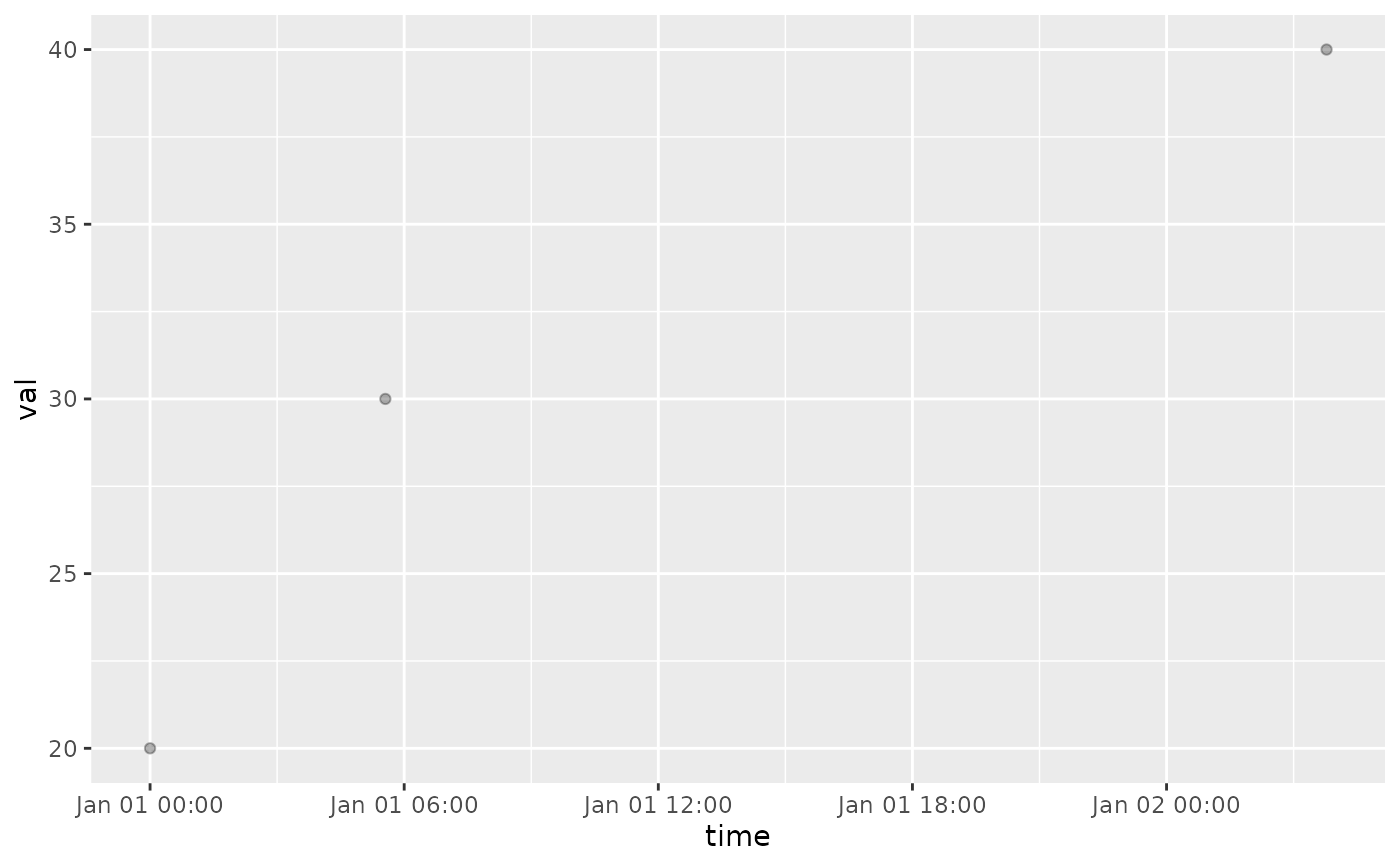
Otherwise, the data will be plotted as points.
Arguments
- plt
(Optional) A ggplot object. it will be added to using the
+operator. Defaults to NULL, in which case a blank ggplot object will be created.- fcst
A forecast object (see output of
create_forecast()).- alpha
(Optional) The alpha parameter to be passed to
ggplot2- colour
(Optional) The colour to be passed to
ggplot2
Examples
plot_ensemble(
  NULL,
  create_forecast(dplyr::tibble(time=rep(1:3,each=3), sim=rep(1:3,3), val=c(4:12))
))


NULL |> plot_ensemble(create_forecast(data.frame(
  time=lubridate::as_datetime(c(0,20000,100000)),
  val=c(20,30,40)
)))
NULL |> plot_ensemble(create_forecast(data.frame(
time=lubridate::as_datetime(c(0,20000,100000)),
val=c(20,30,40)
)))