Wrapper for plot_observations().
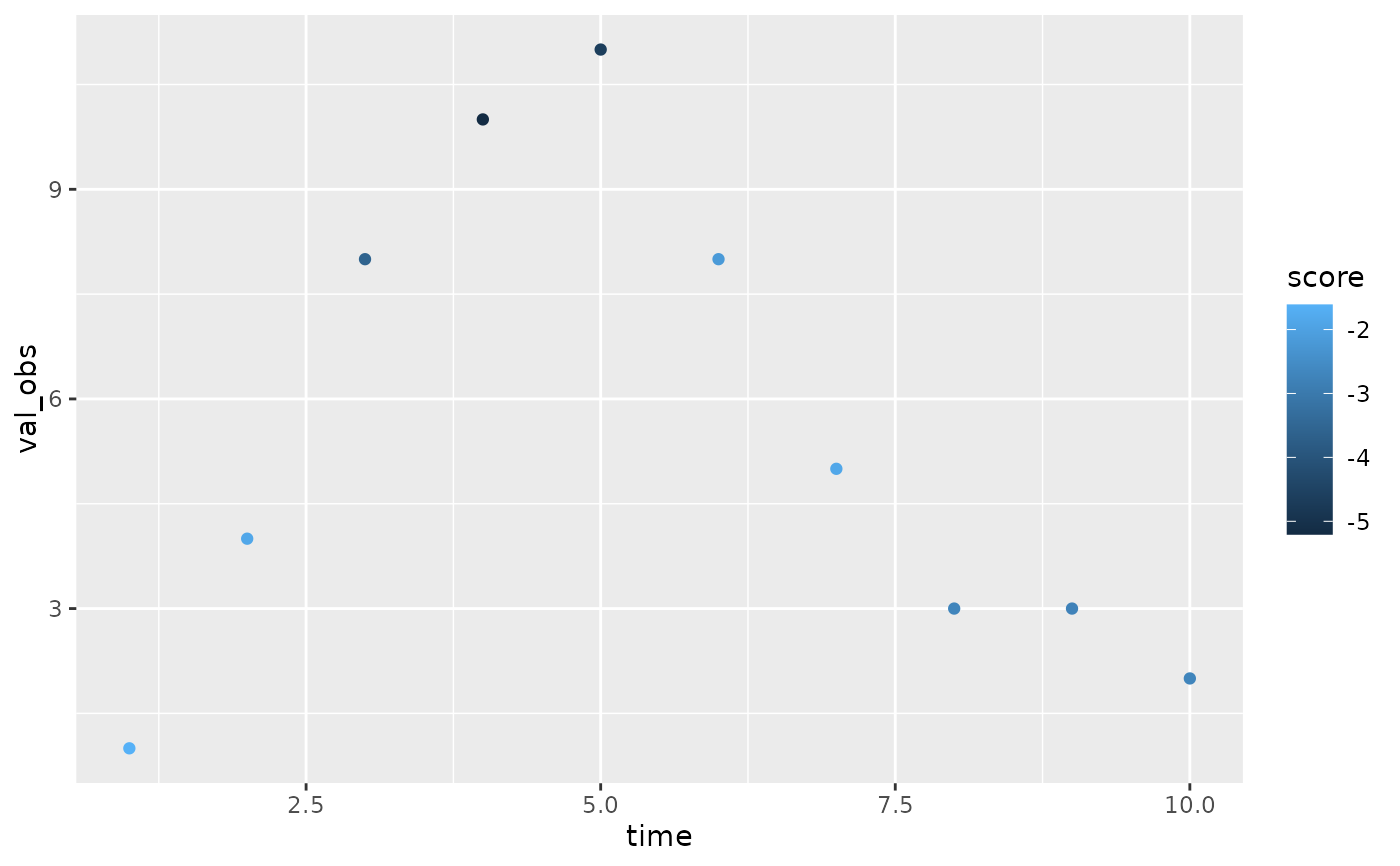
Scores the given forecast against the given observations,
then plots the observations with a colour scale corresponding to score.
Arguments
- plt
(Optional) A ggplot object. it will be added to using the
+operator. Defaults to NULL, in which case a blank ggplot object will be created.- fcst
A forecast object (see output of
create_forecast()).- obs
An observations data frame
- invert_scale
(Optional) a boolean. If
TRUE, the color scale will be inverted. This is useful for scores where smaller values are better, e.x. CRPS.- score
(Optional) A scoring function. The function will be used to score
fcstagainstobs. A scoring function should accept a forecast object, an observations data frame, as well as asummarizeargument. See?accuracy,?log_scorefor examples. Seevignette(topic='casteval', package='casteval')for details.- ...
Additional parameters to be passed to
score. Note thatsummarizeshould not be one of them, sincecastevalalready passes that toscore.
Examples
fc <- create_forecast(list(
  time=1:10,
  vals=list(
    c(1,2,3,5,4,5,4,6,6,5),
    c(1,3,5,4,6,5,7,9,8,8),
    c(1,4,3,4,5,6,5,3,2,2),
    c(1,2,4,5,7,8,7,9,10,9)
  )
))

obs <- data.frame(time=1:10, val_obs=c(1,4,8,10,11,8,5,3,3,2))

NULL |> plot_obs_score(fc, obs, score=log_score, bw=2)