Plot observation points. If scores are provided alongside the observations, the plot can be colour-coded to convey information about score, accuracy, etc.
Arguments
- plt
(Optional) A ggplot object. it will be added to using the
+operator. Defaults to NULL, in which case a blank ggplot object will be created.- obs
An observations data frame. If it contains a
scorecolumn, the observation points will be colour-coded according to the scores. Otherwise, thealphaandcolourparameters will determine the opacity and colour of the points.- alpha
(Optional) The alpha parameter to be passed to
ggplot2- colour
(Optional) The colour to be passed to
ggplot2
Examples
fc <- create_forecast(list(
time=1:3,
vals=list(c(4,7,10), c(5,8,11), c(6,9,12))
))
obs <- data.frame(time=1:3, val_obs=c(5,9,13))
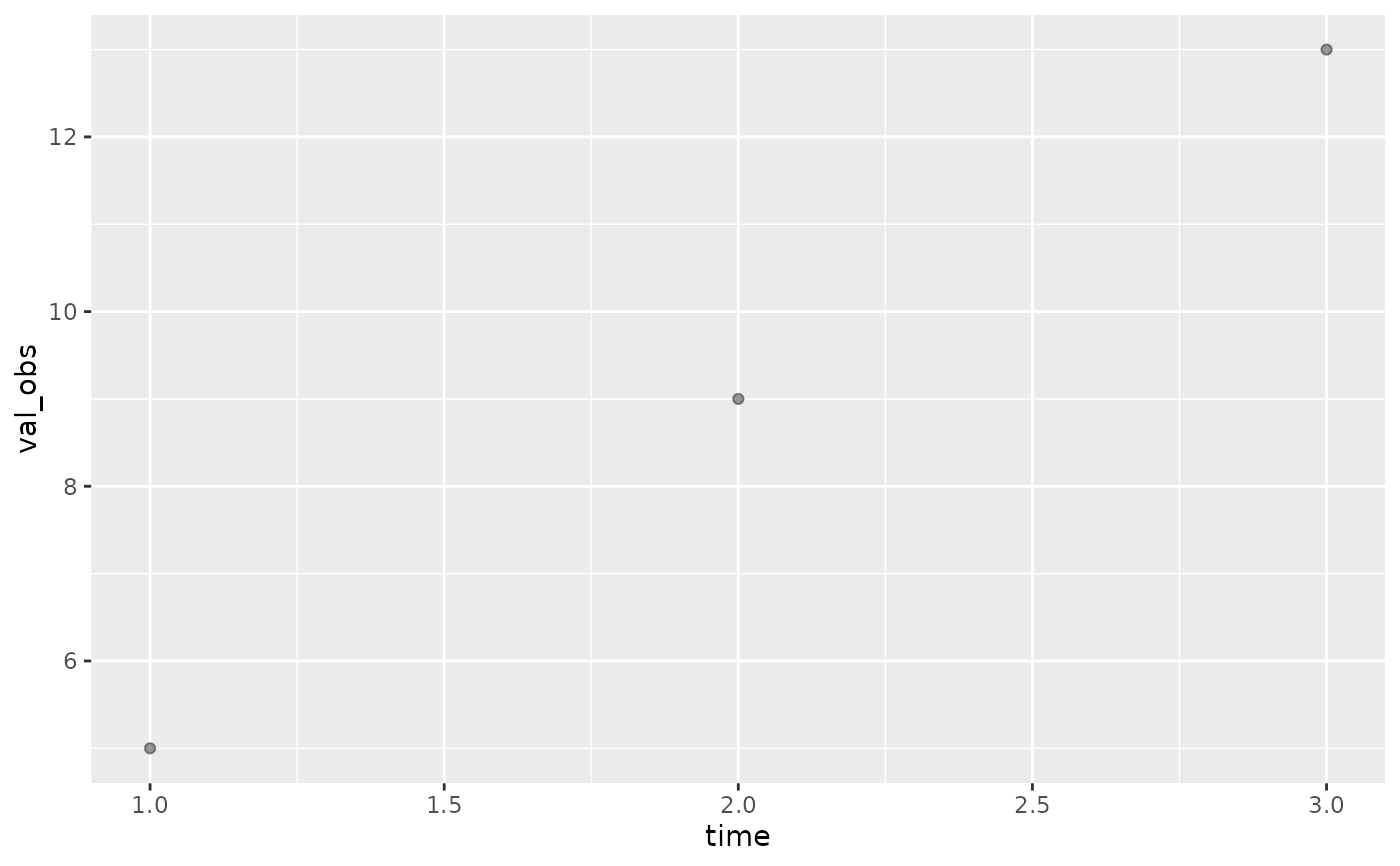
# plot observations on their own
plot_observations(NULL, obs)
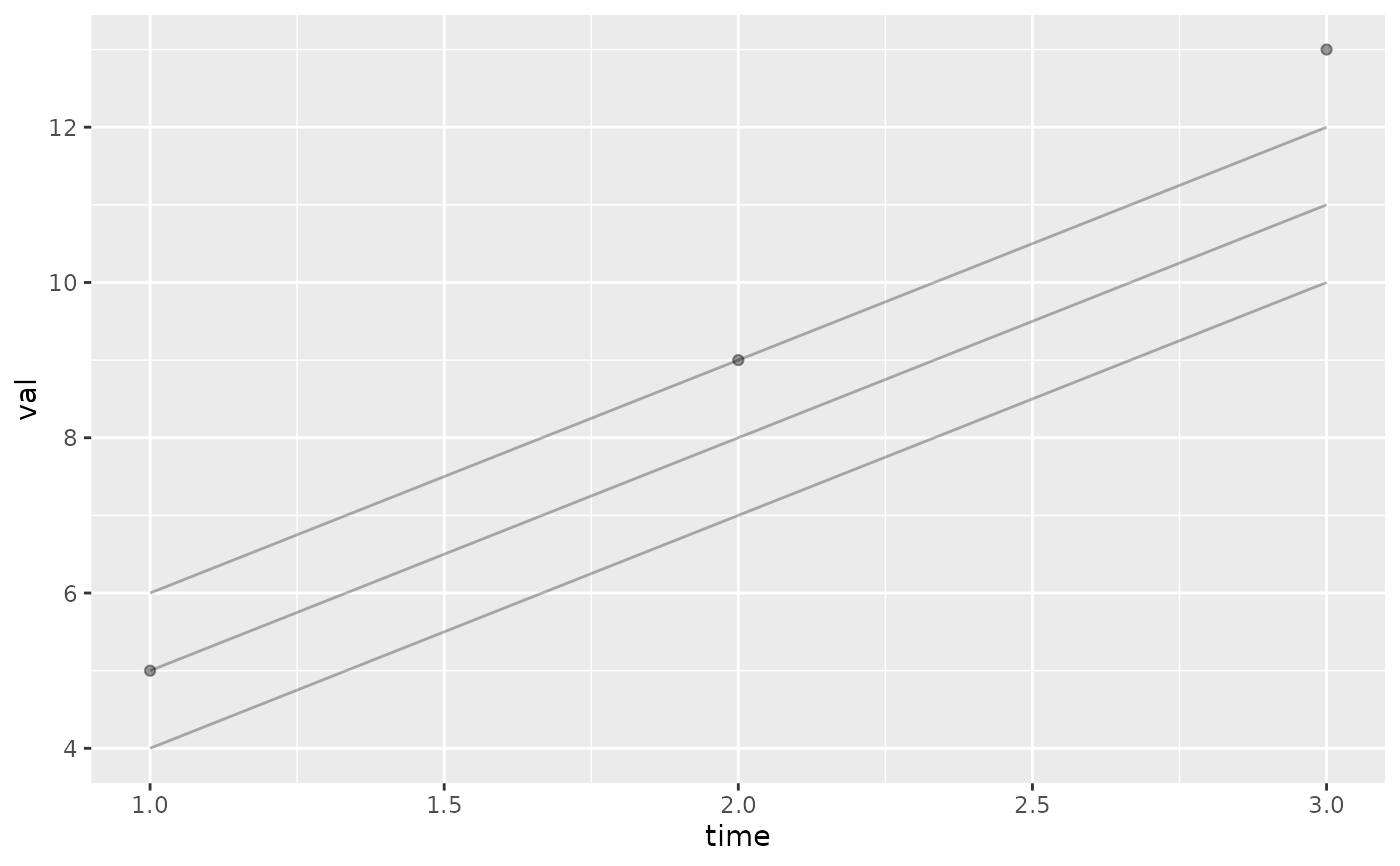
 # plot observations alongside forecast data
plot_observations(plot_ensemble(NULL, fc), obs)
# plot observations alongside forecast data
plot_observations(plot_ensemble(NULL, fc), obs)
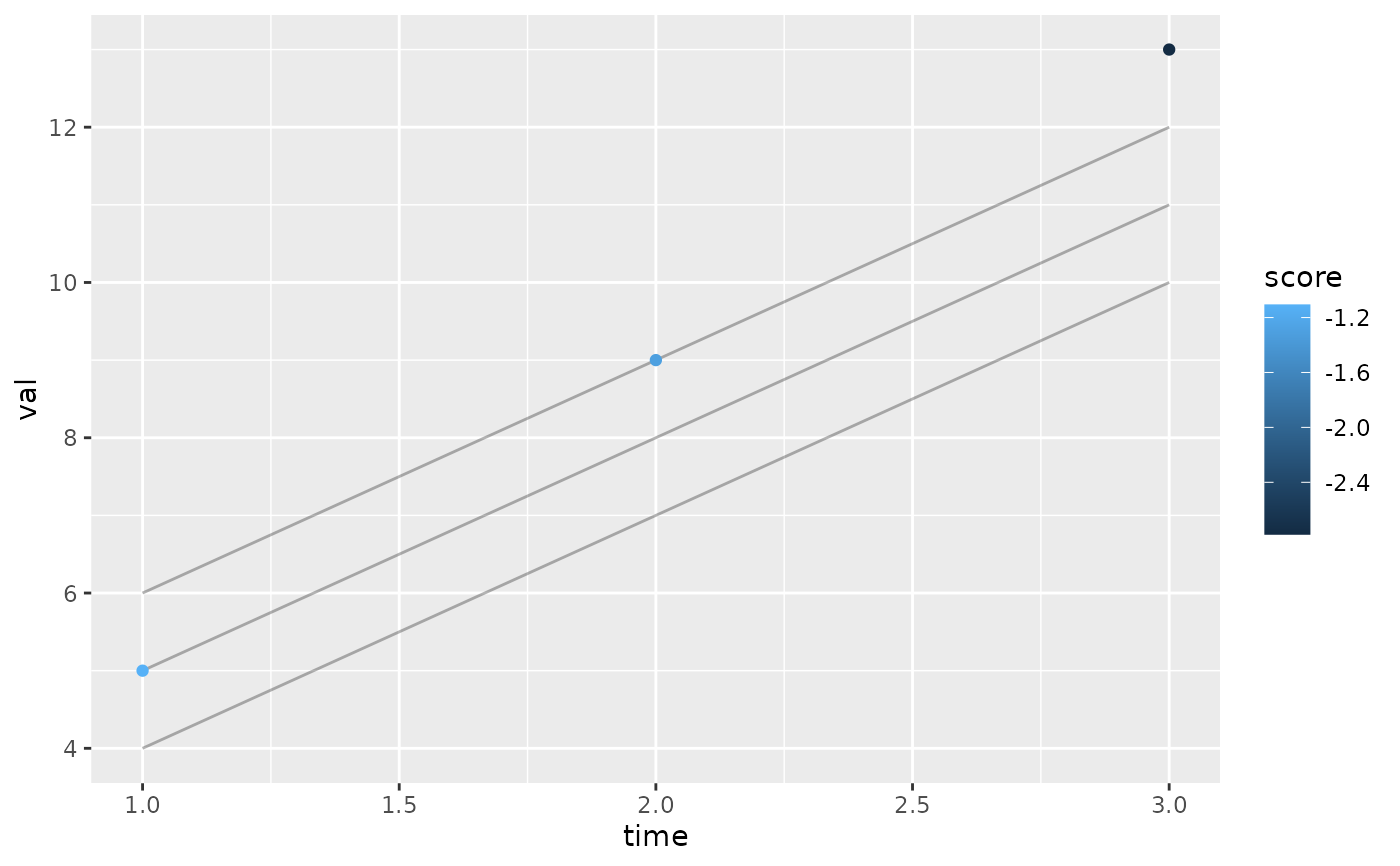
 # plot observations alongside forecast data, and colour-code by score
plot_observations(
plot_ensemble(NULL, fc),
log_score(fc, obs, summarize=FALSE)
)
# plot observations alongside forecast data, and colour-code by score
plot_observations(
plot_ensemble(NULL, fc),
log_score(fc, obs, summarize=FALSE)
)